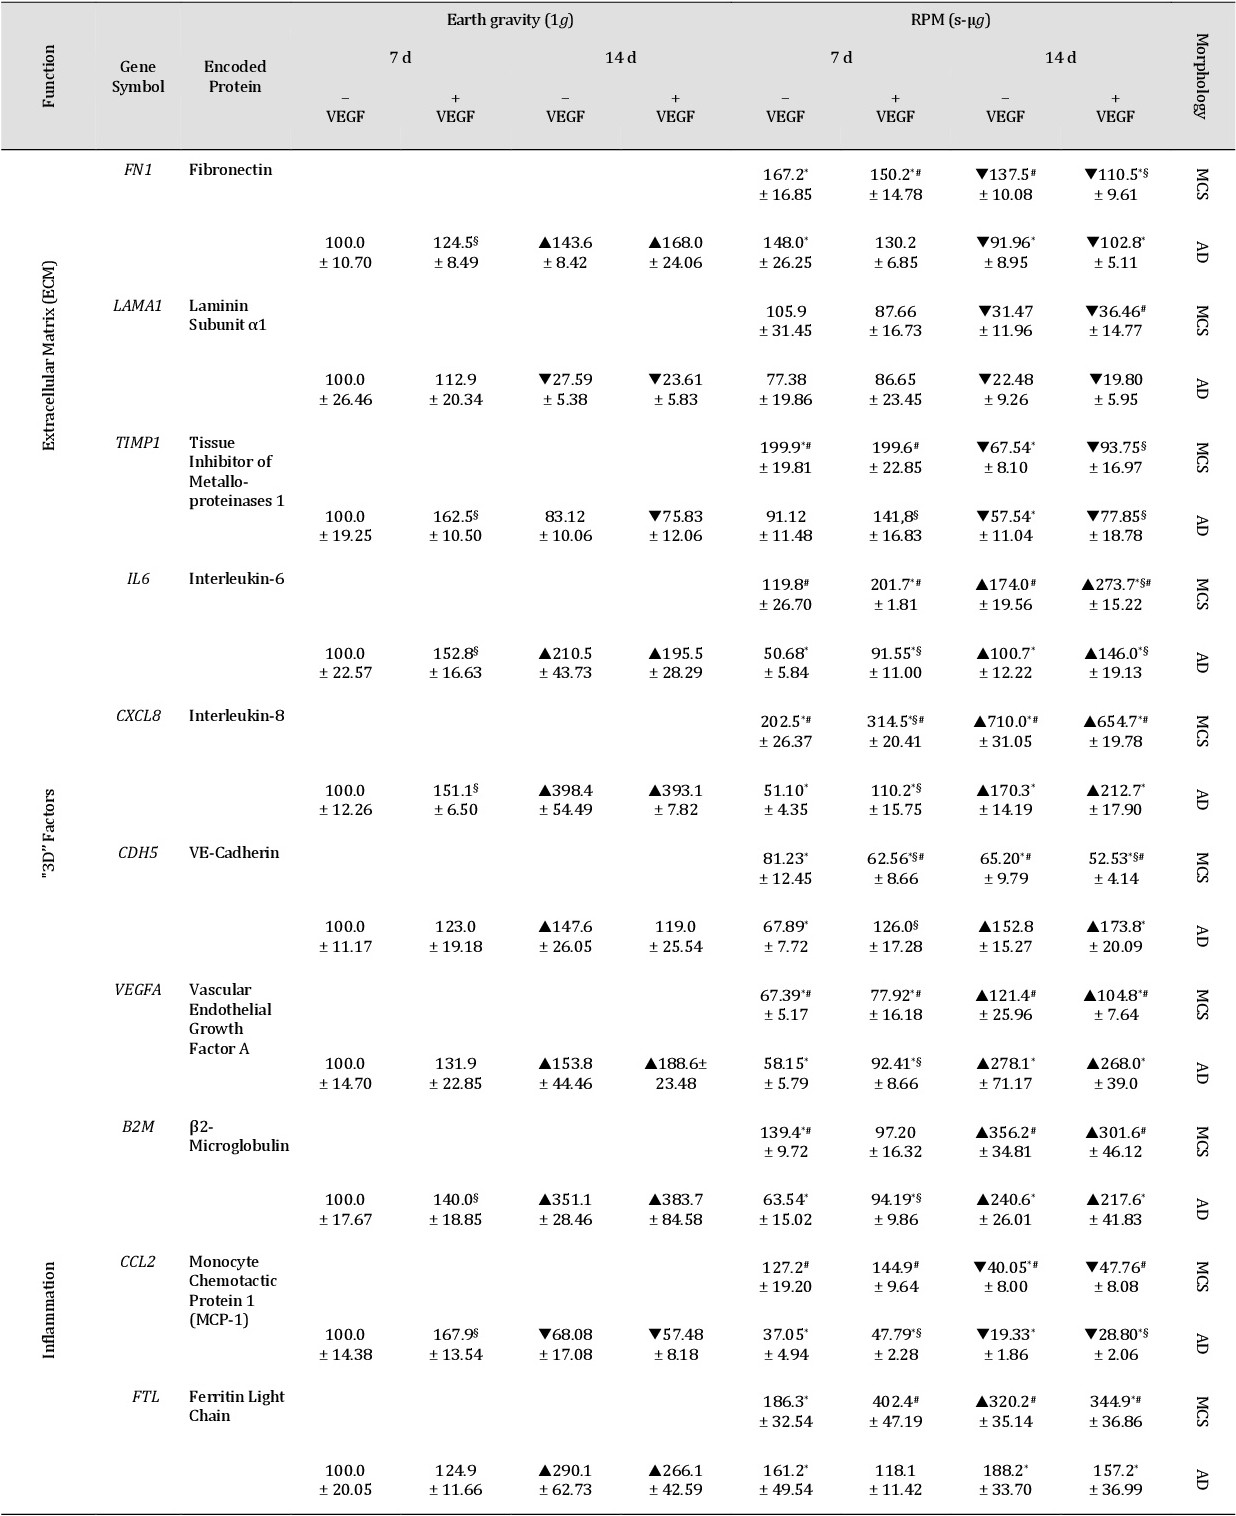
Table 6. Gene expression of EA.hy926 cells after exposure to the RPM compared with 1g controls. Cells were cultured in slide flasks. The data was generated by using qPCR. Values are given as mean ± SD; *: P <0.05 vs. 1g; ▼|▲: P <0.05 vs. 7d; §: P <0.05 vs. −VEGF; #: P <0.05 vs. AD; AD: Adherently growing cells; MCS: Multicellular spheroids; n.d.: not detectable. 18S was used as housekeeper. LAMB2 (Laminin Subunit β2), COL1A1 (Collagen Type I α1 Chain), and CCL11 (Eotaxin-1) mRNA levels were below the LLOQ